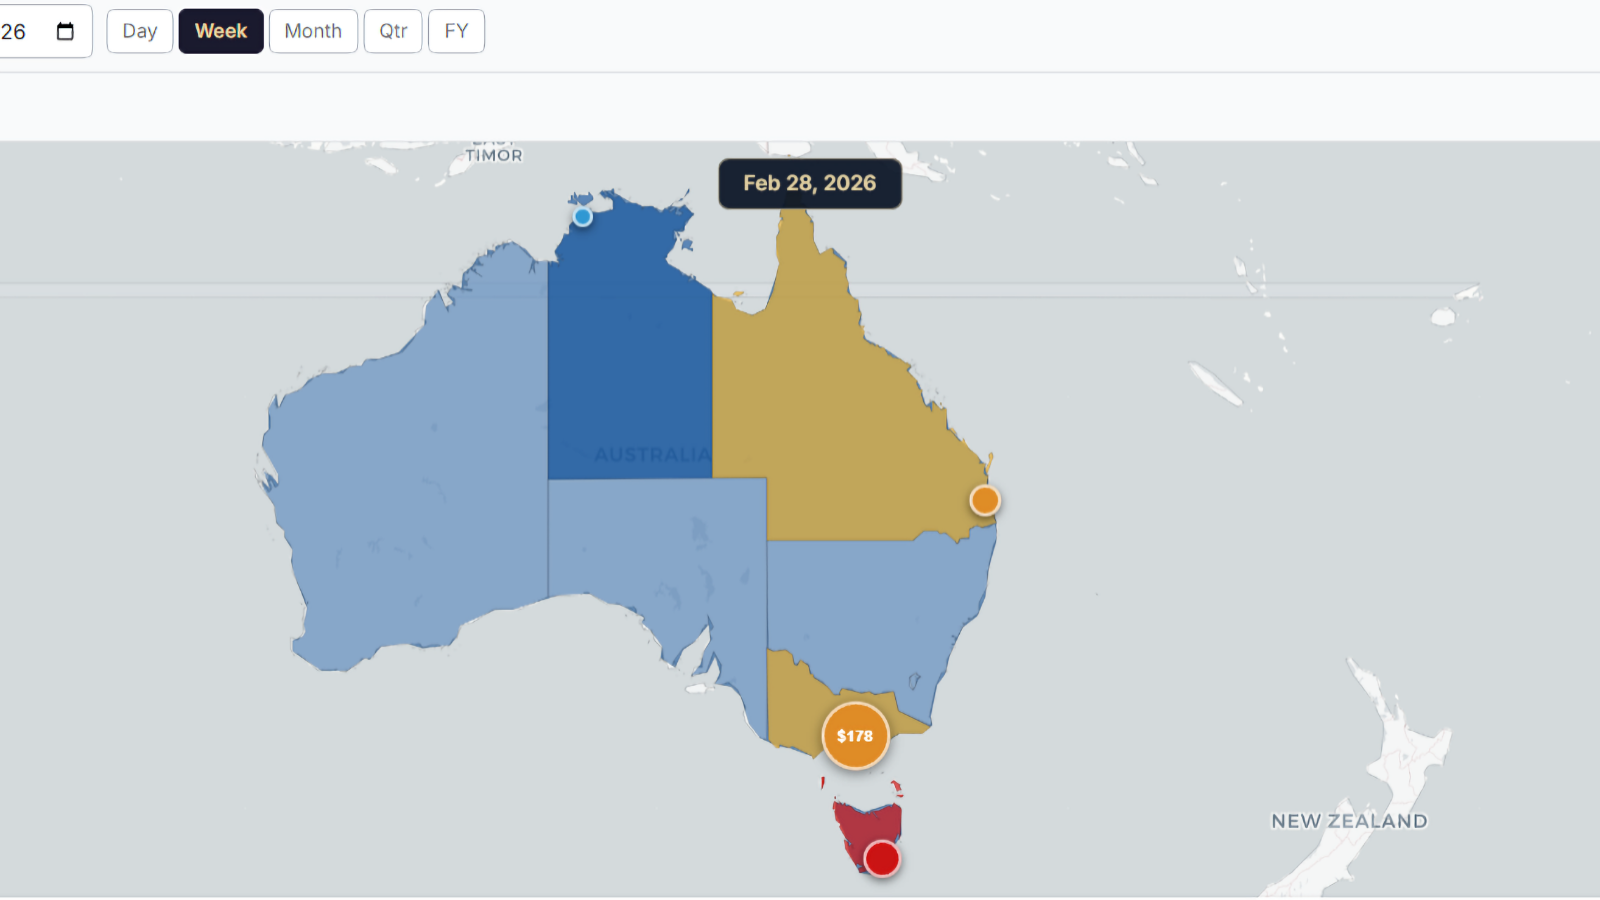
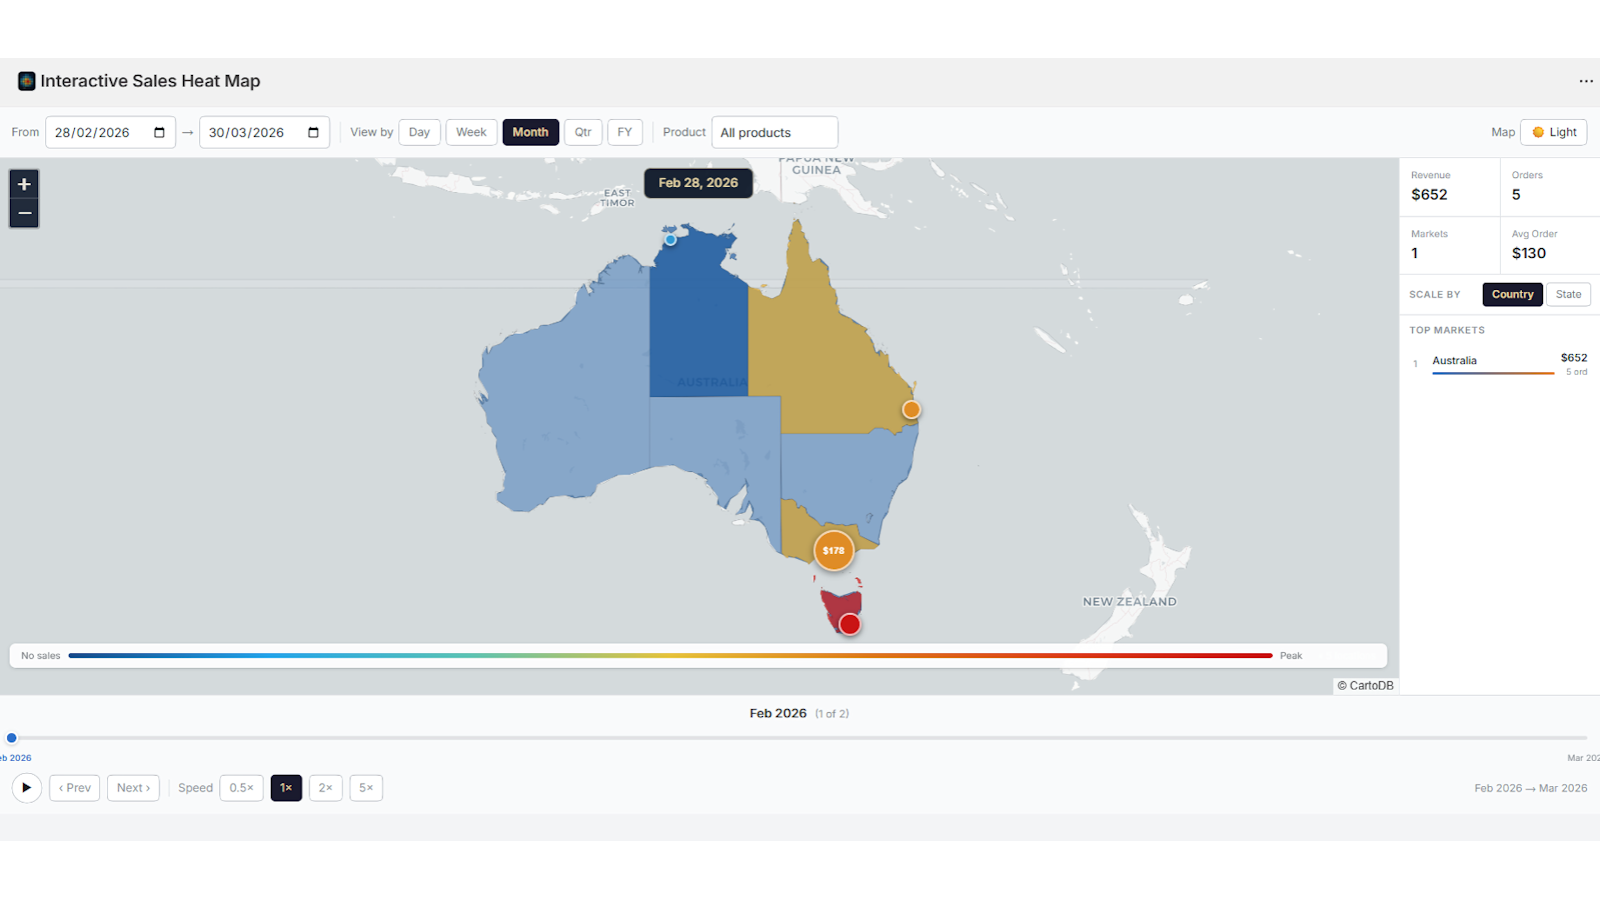
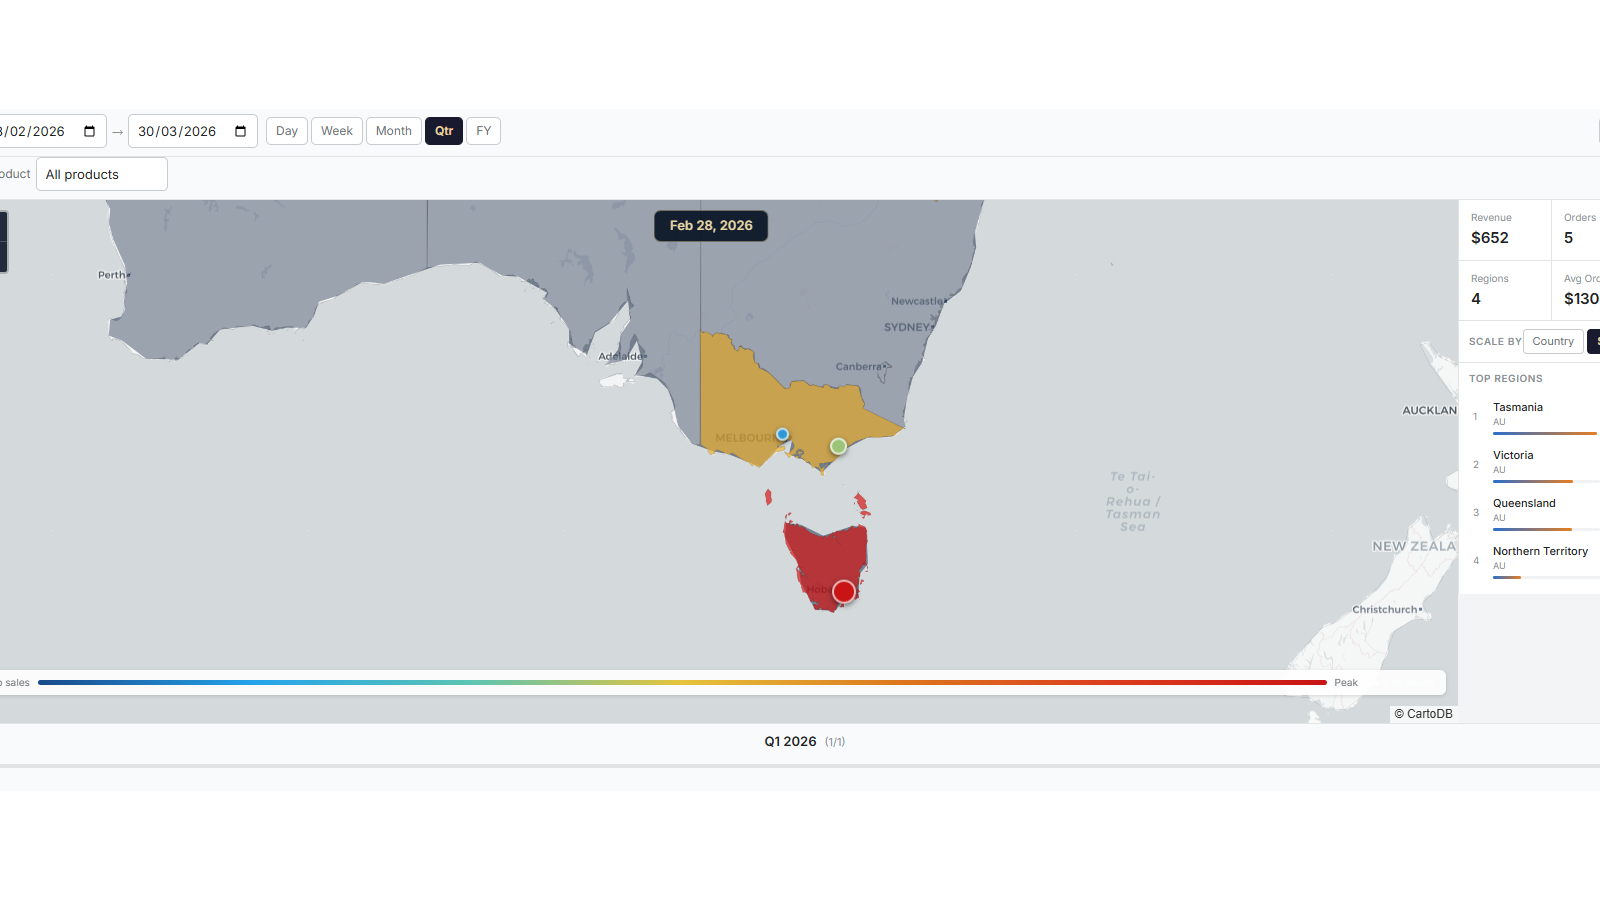
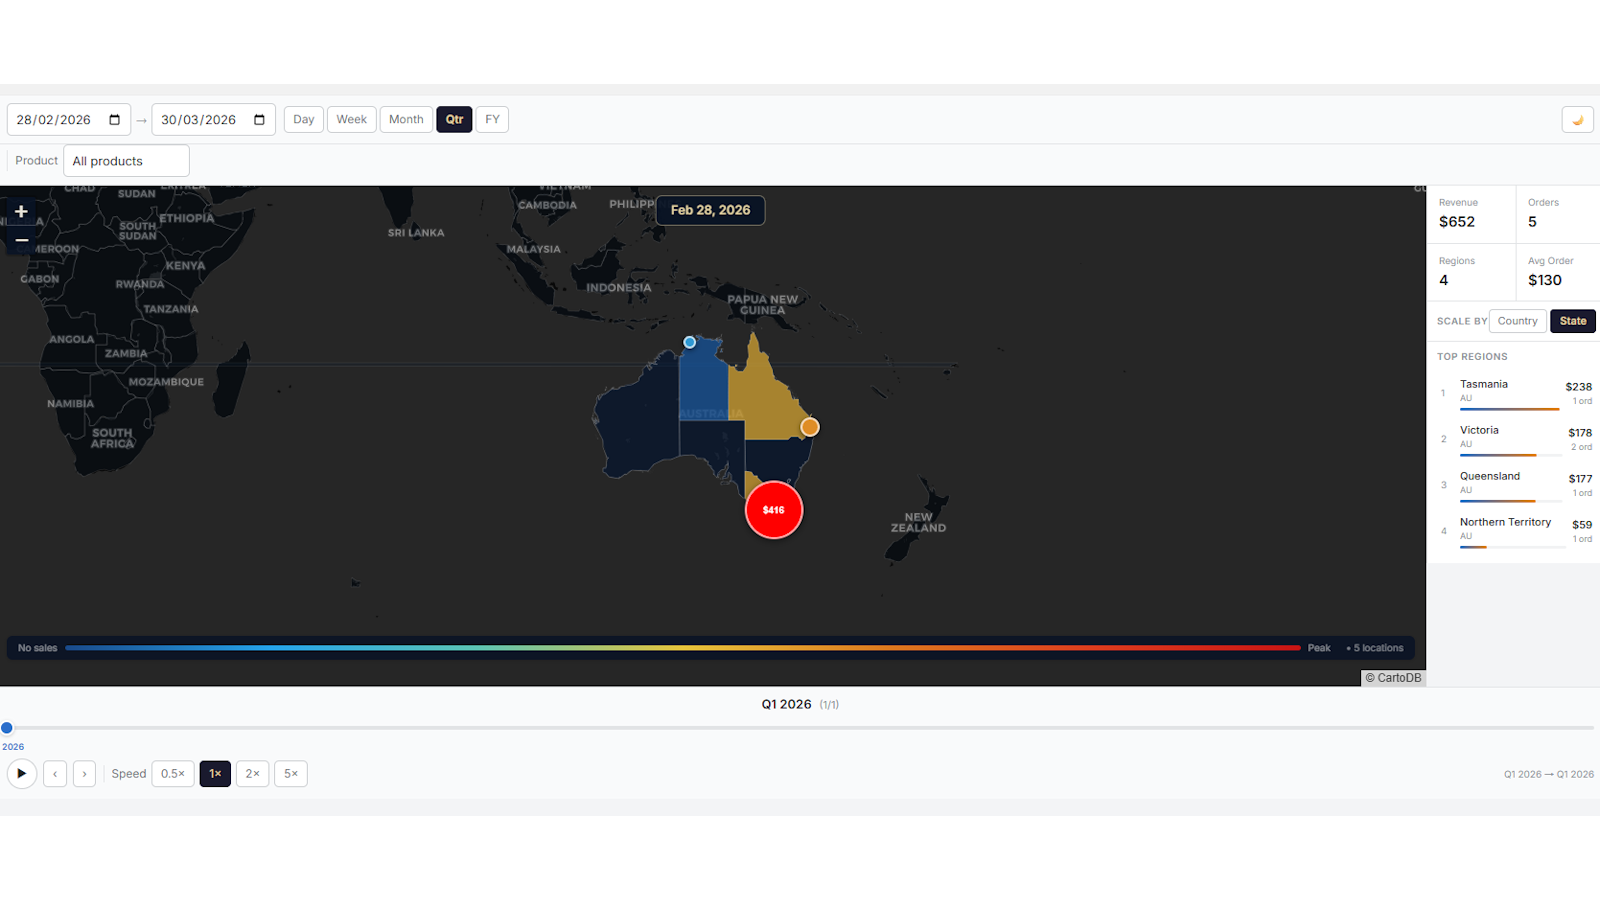
Interactive Sales Heat Map Shopify App: Pricing, Features & First-Adopter Watch
AnalyticsBy Meadrisker SoftwareLaunched April 29, 2026Updated May 1, 2026
Interactive Sales Heat Map launched on April 29, 2026. Shoplist is watching for its first storefront installs and tracking pricing in the meantime.
Key signals for Interactive Sales Heat Map
- Launched
- Apr 29, 2026
- Pricing
- Free trialThen from $5
- Storefront installs
- None yetWatching since its Apr 29, 2026 launch
Interactive Sales Heat Map pricing
- Monthly Plan
- $5
Alternatives to Interactive Sales Heat Map
Apps merchants weigh against Interactive Sales Heat Map, with their own detected stores and ratings.
Keep watching Interactive Sales Heat Map.
Get alerted on first storefront installs, review spikes, pricing changes, and listing edits.